Noa Sato · Urban microclimate researcher
Heat changes at the curb.
I study what a temperature reading can tell us about walking one block. The interesting part is how much changes between the two sides of the street.
Compare three blocks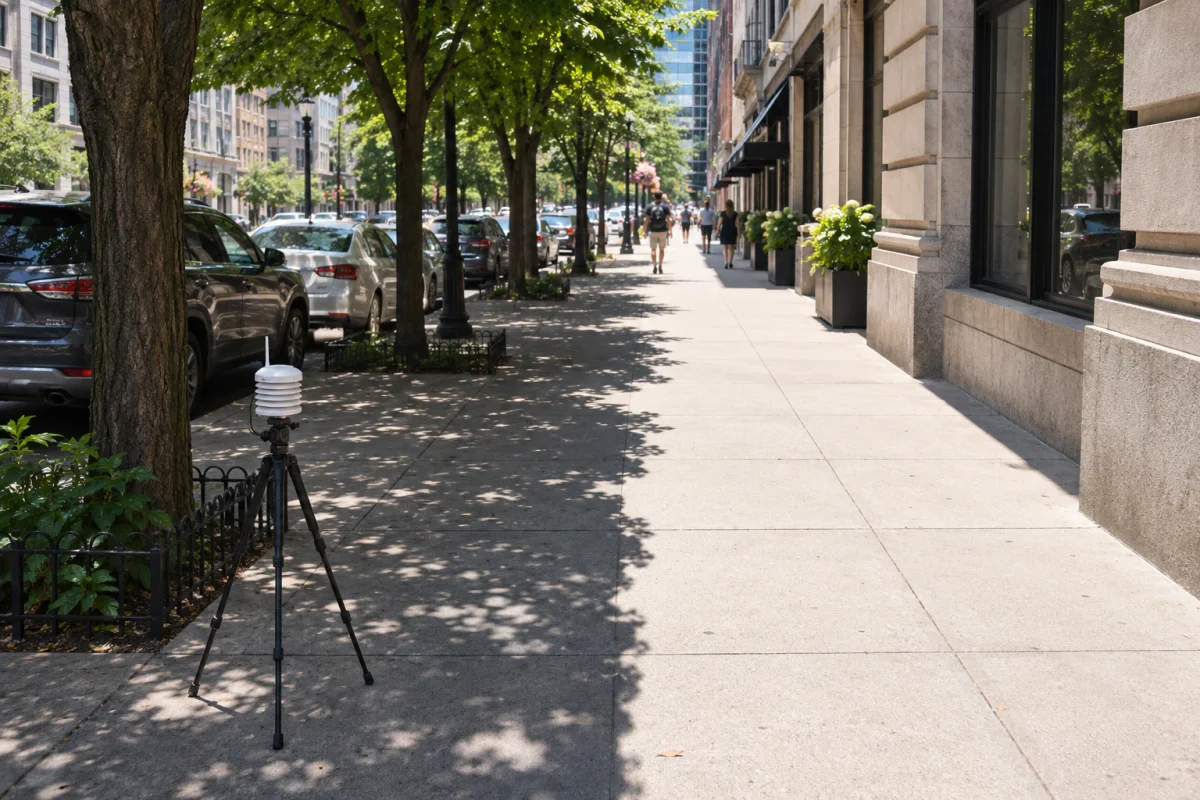
Pedestrian heat · Sample study
The paired walks.
Each comparison holds the block and time fixed, then looks at two points with different shade. Switch blocks to read the observation that goes with each pair.
Cedar Street
1.6 °C between readings
- Exposed pavement
- 34.4 °C
- Shaded pavement
- 32.8 °C
Tree canopy shades the west curb. The two sensors sit at the same height, with about six metres between them.
Illustrative readings from the sample study. The chart shows air temperature from 30 to 36 °C.

About Noa
I study the conditions a pedestrian actually walks through. My work is for planners and research teams who need to see the reading, the place where it was taken, and the uncertainty that comes with it.
Collaborate on a field study.
I’m interested in working with people who know how their streets are used. A good first conversation starts with one route, who walks it and the decision your team is trying to make.